
Dashboards
Every workspace includes six role dashboards: CEO overview, CFO overview, Accounting, Operations, Project manager and HR & people.
Finding your way around
The menu lists sections, not every dashboard: Leadership, Accounting, Projects, HR & people, plus any sections your firm added. Select a section to open the dashboard you last looked at in it, and use the arrow beside it to fold its list open or closed. Dashmor remembers which sections you keep open.
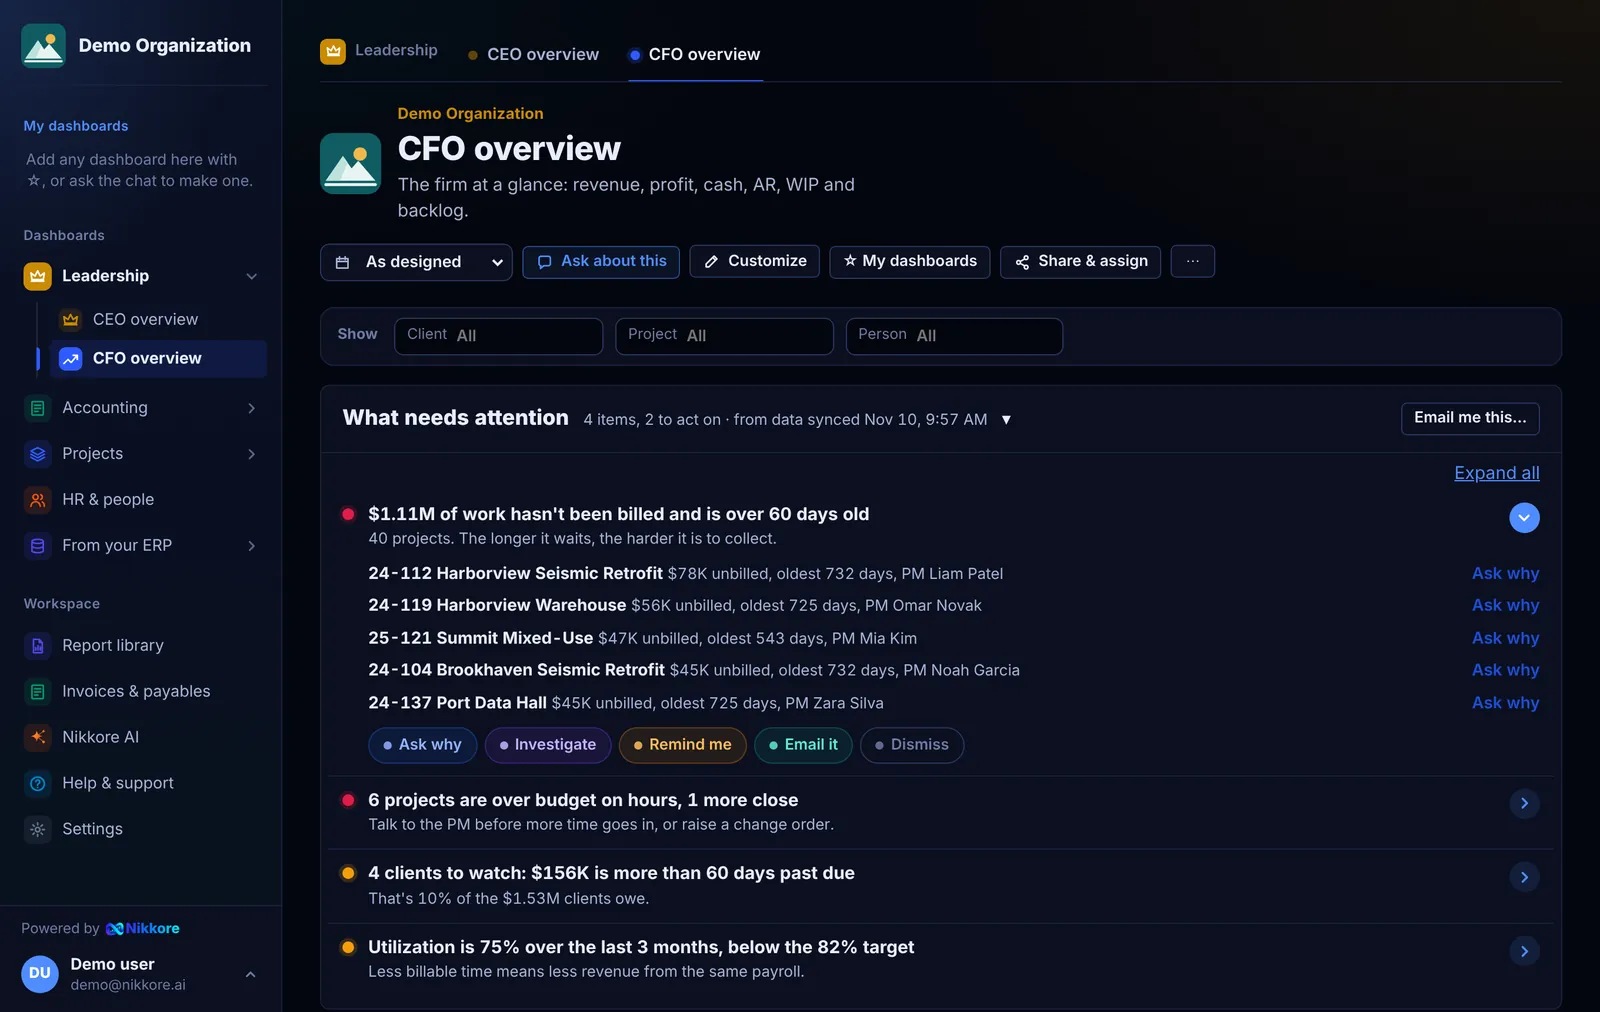
At the top of a dashboard, the other dashboards in the same section are tabs, so you can switch between, say, CEO overview and CFO overview without going back to the menu.
Changing the period
Use the period switch at the top right (This month, QTD, YTD, 12 months, Last FY) to restate every period-based number on the page. As designed returns to each panel's own period. Your fiscal year start is set in Settings.
How numbers are calculated
Every number comes from a fixed calculation on your synced your ERP data. Dashmor does not estimate. A few definitions:
| Metric | Definition |
|---|---|
| Revenue | Revenue accounts in the GL for the period |
| Net income | Revenue minus all expense accounts |
| Effective multiplier | (Revenue − consultants) ÷ direct labor |
| Overhead rate | Indirect labor, overhead and fringe ÷ direct labor |
| DSO | Open AR ÷ (billings in the last 90 days ÷ 90) |
| Unbilled WIP | Billable time at bill rates not yet invoiced |
| Backlog | Contract value minus billed to date on active and pending projects |
| Utilization | Billable hours ÷ total hours |
See the records behind a number
Point at any tile and select the small list icon in its corner to see the records it's built from: the open invoices behind AR, the bills behind AP, the timesheet lines behind hours and unbilled work, or the ledger entries behind revenue and net income. The list follows the dashboard's period and filters, and shows what people wrote on each timesheet line. When the records add up to the tile, you'll see Adds up exactly to the number on the tile. You only see records your ERP access covers. Press Esc or select ✕ to close it.
Fits any screen
Dashboards use the full width of your screen, from a laptop to a wall display. Charts grow taller on bigger screens, and panels stretch so rows never end half-empty. Each panel has its own color so the page reads at a glance.
Changing a dashboard
The bar at the top of every dashboard has the period, Ask about this (the chat explains what stands out), Customize, Share, and ⋯ for pinning and email. Under Customize, pick Change it myself to change any tile or section, or Redesign with AI to preview new layouts. Every save becomes a version you can switch back to. See Edit dashboards and versions.
Assigned dashboards and your home
Dashboards an admin assigned to you appear at the top of the sidebar under Assigned to you. The one marked Home opens first when you sign in.
Dashboards for every role
Every firm gets a detailed dashboard for each role, in sections, sorted into the menu:
- Leadership: CEO overview (growth, profit, delivery, cash) and CFO overview (profit & loss, cash & receivables, efficiency, income statement).
- Accounting: Accounting (today's unbilled WIP, what clients owe, DSO and what you owe; WIP & billing; AR and AP aging side by side; the books), Receivables (AR) (aging, billed vs collected, aging by client, open invoices, invoices coming due, how fast each client pays, AR by project) and Payables (AP) (open AP, bills due, cash on hand, AP aging, cash in and out, bills by vendor and by project). The three are tabs on one another's pages.
- Projects: Operations (every project's status, risk, hours and money), Project manager (a PM's own projects: budget, profit, hours, what to bill, what clients owe).
- People: HR & people (utilization and hours by person, team and week).
The same dashboard is safe for everyone: each person only sees the projects their ERP access covers. A project manager opening Project manager sees only their own projects.
Teams made from your ERP groups get the matching dashboard as their home page: CFO groups get CFO overview, owners and executives get CEO overview, accounting gets Accounting, project managers get Project manager, operations gets Operations, and HR gets HR & people.
Change any of them. Admins can edit a dashboard or redesign it with AI, for everyone, for one team or just for themselves, and move it to another part of the menu (⋯ › Where it sits in the menu). Anyone can make their own view.
Or just ask. In the chat, say what you want: "Add DSO to the Accounting dashboard", "Take consultant bills off the Project manager dashboard, just for me", "Build me a dashboard of hours by week for my projects". Admins can add "for everyone" or "for the Operations team".
My dashboards, your own sections, and teams
My dashboards is the section at the top of your menu. Dashboards you make yourself land there, and so does any dashboard you keep from the chat (Add to My dashboards). On any other dashboard, select ☆ My dashboards to add it. It's personal: nobody else's menu changes.
Your own sections (admins): add sections to the menu for the way your firm works, such as Eastside office or Westside office. On a dashboard, open ⋯ › Where it sits in the menu, pick a section, or type a new name and press Enter. Everyone who can see the dashboard finds it there.
From the chat: "Make a section for the Eastside office", "Put the Operations dashboard under Eastside office", "Create an Eastside team with Sam and Dana and assign the Operations dashboard to them", "Remove the Westside section". A section is where a dashboard sits in the menu; a team is who gets it.
Dashboards open with a little motion: the headline numbers count up to their value and the tiles arrive in order, numbers first, then charts, then tables. When you change the period or a filter, the numbers glide to their new values. If your computer or phone is set to reduce motion, Dashmor shows everything still.
Where a project stands
On any table that lists projects (Project manager, Operations, Project profitability, Projects at risk…), select a project to see its journey from Started to Fully billed. The marker sits at how much of the fee has been billed. It turns amber when hours are running ahead of billing and red when they're well ahead or over budget. Under it: fee, billed, collected, not billed yet, hours used against the budget, and the PM. Select Investigate and Dashmor looks into the project for you: what's going on, why (from the numbers and the notes people wrote on their timesheets), and a 30/60/90-day plan. It also saves a small dashboard for that project. You only see projects your ERP access covers.